By Robert Crosby | VP of Institutional Sales | Finaeon, Inc.
“I’m not here to give you a trading tip. I’m just someone who loves data — and this week, present one series that has me hooked.”
Everyone talks about the S&P 500. The Dow. Nasdaq. The names you hear on the news, the benchmarks that dominate conversation. Some of the most interesting data I have seen here at Finaeon doesn’t live in the headlines, it lives in the sidelines.
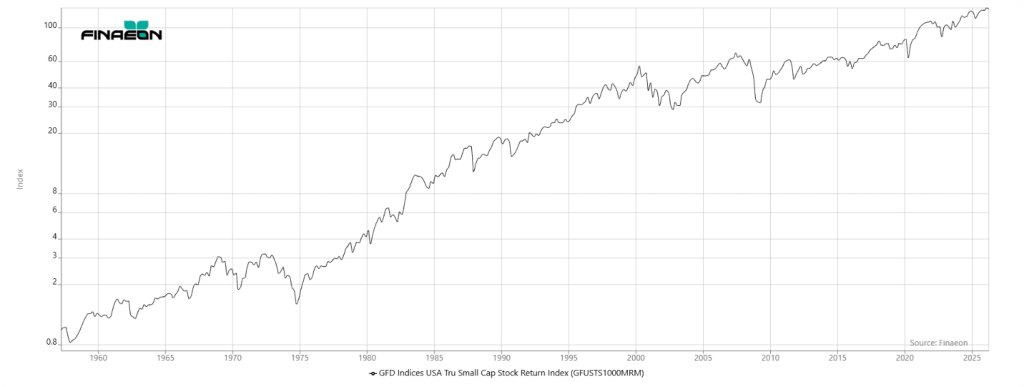
This week I’ve had my eye on the GFD USA True Small Cap Stock Return Index — ticker GFUSTS1000MRM. It’s one of those series that the more you look at it, the more questions it starts answering.
Here’s what makes it interesting to me. This index goes back to March 1, 1957 (daily) and it tracks the bottom 10% of the 1000 largest U.S. listed companies by market cap. We’re talking about the smallest names among the big ones. Not penny stocks or speculative plays. Just companies that haven’t broken through to mid or large cap status yet.
Why does that matter? Because small caps tend to be a leading indicator of broader market sentiment. When investors are feeling confident, they reach down the cap ladder. When they get nervous, small caps are usually the first to feel it. Watching this index is a little like watching the tide — it tells you something about what’s coming before the waves hit the shore.
What I love about this particular series is the return index component. It’s not just tracking price movement, it includes total return, meaning dividends are backed in. That’s a meaningful difference when you’re doing long-term analysis. A price-only chart can paint a misleading picture. The return index shows you what investors experienced.
Going back to 1957 with daily granularity is also something most people take for granted until they need it. Want to see how small caps behaved during the 1973 oil crisis? The 1987 crash? The dot-com boom? The 2008 financial crisis? It’s all in there, at the daily level, ready to analyze.
I think about clients who are building models, back testing strategies, or writing research, this kind of granularity and periodicity that sets solid research amongst the speculative. It is the difference between an “acceptable” dataset and a spectacular one.
Does this sound like the type of data that will benefit your work? Is this something that piques your curiosity? And do you have any questions about other indices in our data catalog? — I’d love to have a conversation. No pressure, no pitch deck. Just a data guy who genuinely enjoys talking about DATA!
ABOUT THE AUTHOR
Robert Crosby
Finaeon, Inc. | Friendly sales guy who genuinely loves data. Always happy to connect and talk through what’s possible.