Bryan Taylor, Chief Economist, Global Financial Data
Global Financial Data tracks bull and bear markets in over 100 stock markets. GFD has over 400 years of data to analyze when bull and bear markets have begun and ended and the number of market tops and bottoms that have occurred each year worldwide. A bear market bottom occurs when the index declines by 20% or more after a 50% increase, and a bull market top occurs when the market rises by 50% or hits a new high after a 20% decline.
Global Bull and Bear Markets
Bear markets occur more quickly than bull markets and over a shorter period of time with higher daily volatility, so their occurrence is quickly noted. However, it may take several years for a market to make the 50% recovery that signifies a new bull market, and it is only then that analysts realize that the stock market is benefiting from a new bull market. Otherwise, a market might decline by 25%, rise by 30%, then decline again by another 25% producing one long bear market and not a series of bear markets.
This is what made the 1929-1933 bear market in the United States or the decline in Japan’s stock market between 1989 and 2012 so memorable. There was a decline, a short-term recovery, another decline and another short-term recovery for years. Investors would expect that as the market bounced back the bear was gone, but the bear only reappeared and drove prices further down, ultimately declining by almost 90%.
How significant a market bottom is globally depends upon the number of markets that hit a bottom and begin bull markets. Global markets are integrated, and bear markets often occur across global markets simultaneously. This was seen in the Covid bear market of 2020. Global markets bottomed out within days of each other, started to rise, and never looked back. Since bear markets usually last a year or two and bull markets last five to ten years, a significant number of bear market bottoms can give investors confidence that a new global bull market has begun that they can invest in for several years to come.
Our analysis of market tops and bottoms differentiates between Developed Markets, Emerging Markets and Frontier Markets. GFD analyzes 25 Developed Markets, 25 Emerging Markets and 58 Frontier Markets. We have found that the Developed Markets are more closely coordinated than the Emerging or Frontier Markets, so the data for the Developed Markets provide a better understanding of global market trends than Emerging or Frontier markets which are more likely to move independently of global trends. Historical data on market tops and bottoms for Developed, Emerging and Frontier markets are available to subscribers.
Figure 1 shows the number of market tops minus the number of market bottoms in each year since 1850 for all the markets in the world. More market tops show the end of a bull market, and more market bottoms show the end of a bear market.
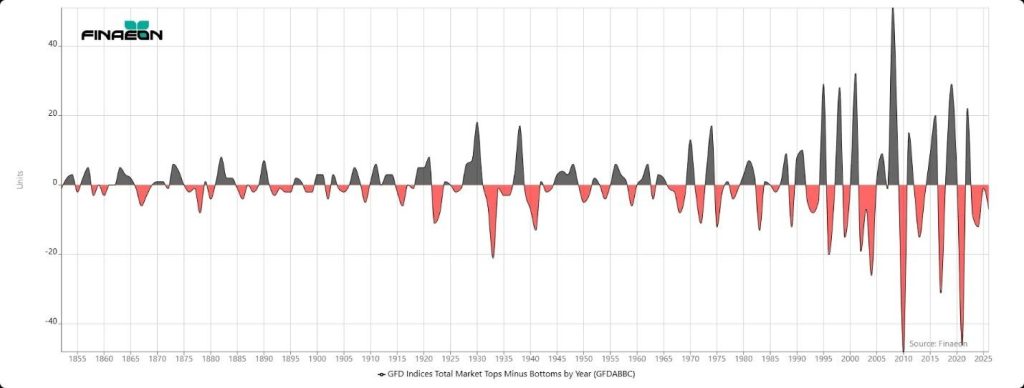
Figure 1. GFD Total Market Tops Minus Market Bottoms, 1850 to 2025
If you look at Figure 2, the market tops in 1920, 1929, 1937, 1969, 1973, 1987, 2001, 2008, 2016, 2020 and 2022 are clearly visible while in Figure 3 the market bottoms in 1921, 1932, 1940, 1974, 1982, 1987, 1998, 2009, 2020 and 2022 are visible as well. There were fewer market tops and bottoms between 1945 and 1966 as the bull market roared ahead.
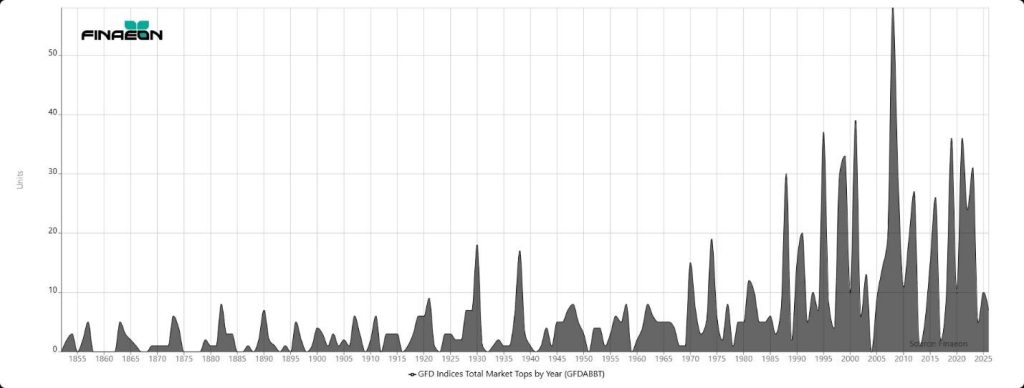
Figure 2. GFD Global Market Tops, 1850 to 2025
The number of tops and bottoms expanded in the 1990s when many emerging markets and former Communist countries opened stock markets, increasing the number of stock markets worldwide. After the market peaked in 2000, it took three years of bear market bottoms for global markets to start moving forward again. 2007 had the largest number of bull market tops in history; however, the number of market bottoms in 2020 when Covid struck exceeded the number of bear market bottoms in either 1998 or 2009. This shows that the degree of integration of global equity markets increased over time.
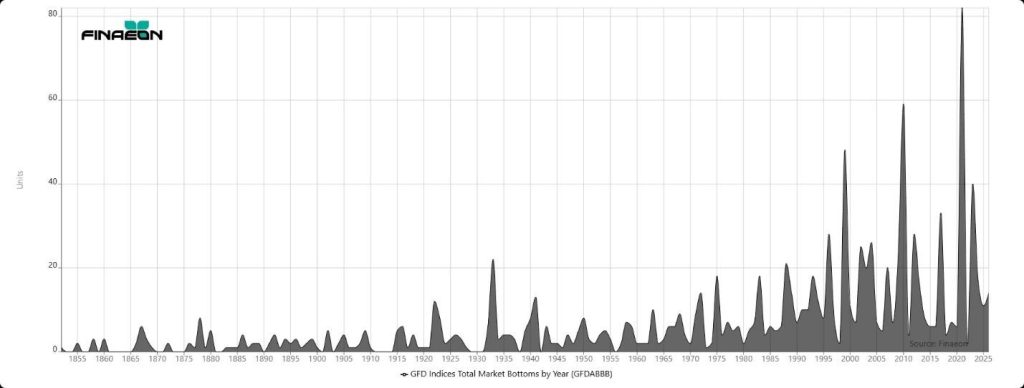
Figure 3. GFD Global Market Bottoms, 1850 to 2025
Between 2009 and 2025, the U.S. Stock market rose dramatically while other global stock markets treaded water. While U.S. Stocks, especially communication and information technology stocks, did well during the past decade, emerging markets and much of Europe failed to exceed their 2008 highs until 2025. This is reflected in the up and down uncertainty of market tops and bottoms. There were tops in the world’s stock markets during this century in 2000, 2007/2008, and 2018-2022 and market bottoms in 2009, 2016, 2020 and 2022.
World Markets in 2025
During 2025 stock markets performed spectacularly. During the past four years, the number of markets hitting bear market bottoms was in the double digits each year. The number of bear market bottoms was greater than the number of bull market tops in each of the past four years. This signals a solid bottom for global markets. While many markets failed to exceed their 2007 or 2020 tops during the past few years, many markets broke through and shot to new highs. The combination of double-digit returns in stock markets, a declining value of the US Dollar, falling bond yields and low inflation provided spectacular returns to foreign investors.
Table 1. Returns in Real USD in 22 countries for Stocks and Bonds in 2025
| Country | Stocks | Bonds | Country | Stocks | Bonds |
| Australia | 15.46 | 6.21 | Italy | 53.33 | 14.43 |
| Austria | 67.99 | 10.46 | Japan | 22.56 | -9.64 |
| Belgium | 35.45 | 10.5 | Netherlands | 25.81 | 10.04 |
| Canada | 34.33 | 3.81 | Norway | 29.7 | 11.15 |
| China | 23.17 | 2.1 | Singapore | 33.06 | 11.59 |
| Denmark | 4.61 | -5.38 | South Korea | 95.99 | -1.87 |
| Finland | 54.59 | 12.71 | Spain | 73.73 | 11.81 |
| France | 26.4 | 10.7 | Sweden | 32.87 | 15.48 |
| Germany | 34.77 | 8.45 | Switzerland | 11.53 | 11.59 |
| Hong Kong | 29.44 | 5.89 | United Kingdom | 31.7 | 10.35 |
| India | 3.04 | 0.99 | United States | 17.01 | 4.97 |
Returns to investors in 2025 were the best they had been in over a decade. Because of the declining value of the US Dollar, fixed income investors in almost every country outside of the United States received double-digit returns. Similar double-digit returns were earned in the stock market as a result of the high returns to the stock markets in different countries. The stock market bottoms that occurred in 2022 have given birth to spectacular returns during the past three years. Of course, fixed-income investors suffered large losses during the increase in bond yields between 2020 and 2022, but fixed-income investors are on the road to recovery.
The equity bear markets that did occur during 2025 were small and most markets have hit a clear bottom from which they are bouncing back. Denmark, for example, suffered a bear market as a result of the decline in the value of Novo Nordisk stock. Argentina’s volatile market suffered short bears in each of the past three years. Hong Kong came close to entering a bear market, but bounced back, and Japan ended the bear market that began in 2024 showing spectacular recoveries that finally pushed its stock market above the highs reached in 1989.
If anything, the concern should be that markets are overstretched and could fall back to more reasonable levels. But there are no signs that the current bull market is over with or that new bear markets are imminent. It would take some unexpected exogenous shock to end the current bull market in 2026. It would not be reasonable to expect the returns of 2025 to be repeated in 2026, but there is no evidence a new bear market will begin in 2026.
GFD includes Australia, Austria, Belgium, Canada, Denmark, Finland, France, Germany, Hong Kong, Ireland, Israel, Italy, South Korea, Japan, Luxembourg, the Netherlands, New Zealand, Norway, Portugal, Singapore, Spain, Sweden, Switzerland, the United Kingdom and the United States as Developed Markets.
GFD includes Argentina, Brazil, Chile, China, Colombia, the Czech Republic, Egypt, Greece, Hungary, India, Indonesia, Kuwait, Malaysia, Mexico, Peru, the Philippines, Poland, Qatar, Russia, Saudi Arabia, South Africa, Taiwan, Thailand, Turkey and the United Arab Emirates as Emerging Markets.
GFD includes Bahrain, Bangladesh, Bulgaria Cote d’Ivoire, Cyprus, Estonia, Iceland, Iran, Jamaica, Jordan, Kenya, Latvia, Lithuania, Morocco, Nigeria, Oman, Pakistan, Romania Serbia/Yugoslavia, Slovakia, Sri Lanka, Tunisia, Venezuela, Vietnam, Zimbabwe, Barbados, Bermuda, Bosnia, Botswana, Costa Rica Croatia, Ecuador, El Salvador, Ghana, Iraq, Kazakhstan, Kyrgyzstan, Lebanon, Macedonia, Malawi, Malta, Mauritius, Mongolia, Montenegro, Namibia, Nepal, Palestine, Panama, Paraguay, Slovenia, Syria, Tanzania, Trinidad and Tobago, Uganda, Ukraine, Uruguay, and Zambia as Frontier Markets by GFD.