By: Michelle Kangas
A Finaeon market history blog using complete historical index data
Moments of political violence - especially assassination attempts on U.S. presidents - represent some of the most acute forms of uncertainty in modern history. These events are sudden, emotional, and destabilizing. Yet, when viewed through the lens of long-term financial data, a clear pattern emerges: markets react sharply, but they recover.
There is a tendency to believe that events of this magnitude should permanently disrupt markets. History tells a different story.
From Abraham Lincoln in 1865 to the attempted assassination of Donald Trump in 2024, markets have consistently demonstrated resilience - not because these events are insignificant, but because financial systems are built to endure beyond any single individual.
The assassinations of Abraham Lincoln (1865), James Garfield (1881), William McKinley (1901), and John F. Kennedy (1963) each occurred during very different economic eras. While high-frequency index data is limited for the 19th century, by the mid-20th century we can observe market behavior with far greater precision - particularly through indices like the S&P 500 and the Dow Jones Industrial Average.
Lincoln (1865): Markets in Their Earliest Form
The assassination of President Abraham Lincoln on April 14, 1865 occurred at a pivotal moment - just days after the effective end of the Civil War. Financial markets in the modern sense were still developing, and while high-frequency equity data is limited, Finaeon’s GFD U.S. 100 Index provides a rare window into market behavior during this period.
Exhibit 1: GFD U.S. 100 Index - Lincoln Assassination Period (1865)
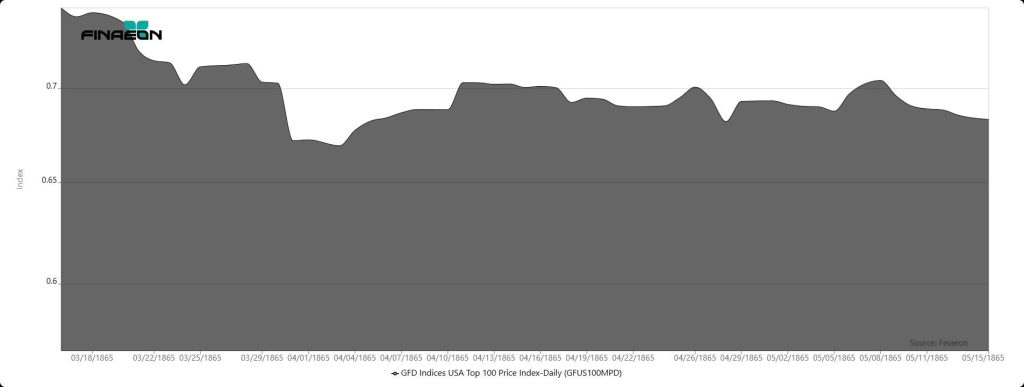
Source: Finaeon. GFD U.S. 100 Index is proprietary intellectual property of Finaeon, Inc.
The data suggests a period of instability and hesitation immediately following Lincoln’s death. However, this reaction must be viewed in context: markets were already digesting the economic transition from wartime to peacetime. The assassination added uncertainty, but it did not fundamentally alter the trajectory of recovery already underway.
Even at this early stage, the pattern begins to emerge - shock layered onto existing conditions, followed by stabilization.
Garfield (1881) and McKinley (1901): Early Market Signals
By the time Presidents James Garfield and William McKinley were assassinated, markets were more structured, though still far less liquid and transparent than today. Garfield was shot on July 2, 1881 and died on September 19, 1881. McKinley was shot on September 6, 1901 and died on September 14, 1901.
Exhibit 2: GFD U.S. 100 Index - Garfield Assassination Period (1881)
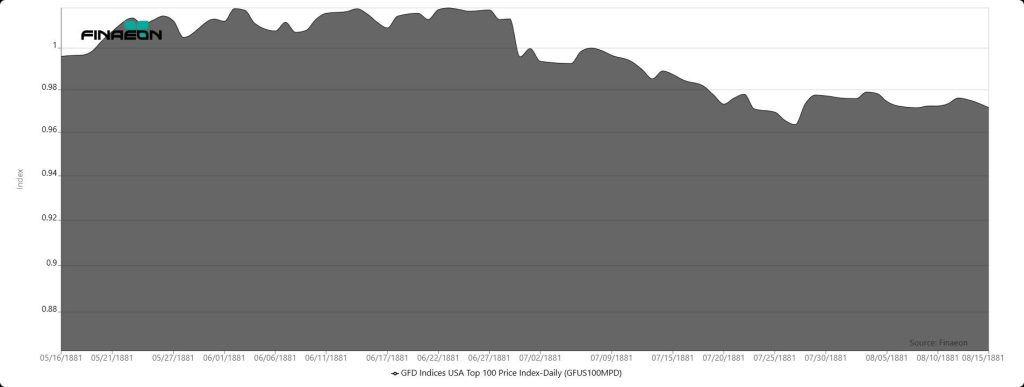
Source: Finaeon. GFD U.S. 100 Index is proprietary intellectual property of Finaeon, Inc.
Exhibit 3: Dow Jones Industrial Average - McKinley Assassination Period (1901)
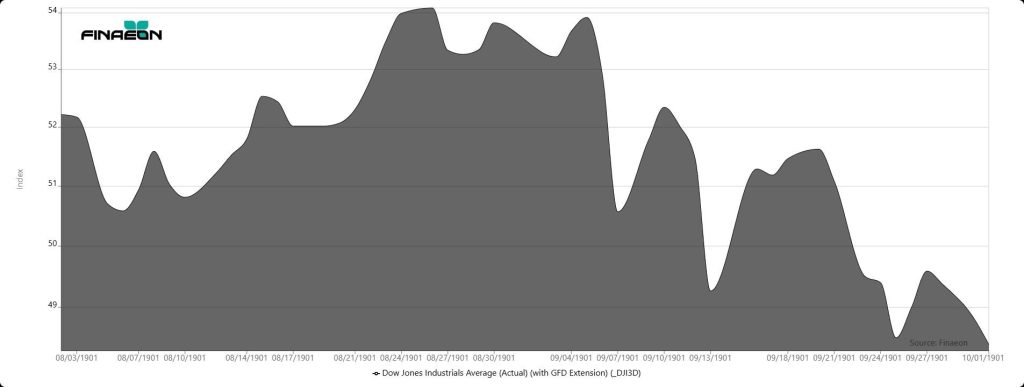
Source: Finaeon. Dow Jones Industrial Average historical data with GFD extension.
In both cases, market reactions were present but not catastrophic. Price movements reflected uncertainty, yet there was no prolonged collapse. These events reinforce an important idea: even before modern financial systems matured, markets were already demonstrating an ability to absorb political shocks.
Kennedy (1963): The Modern Shock Template
The assassination of President John F. Kennedy on November 22, 1963 provides one of the clearest and most well-documented examples of market reaction. U.S. equity markets experienced an immediate shock. The New York Stock Exchange closed early that day. The following trading session saw a sharp decline in both the Dow Jones Industrial Average and the S&P 500, reflecting uncertainty and fear.
Exhibit 4: S&P 500 Composite Price Index - Kennedy Assassination Period (1963)
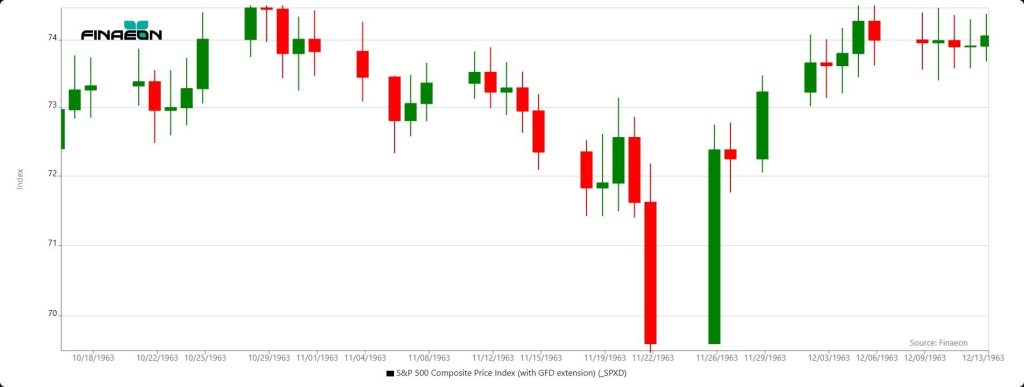
Source: Finaeon. S&P 500 Composite Price Index with GFD extension.
Exhibit 5: Dow Jones Industrial Average - Kennedy Assassination Period (1963)
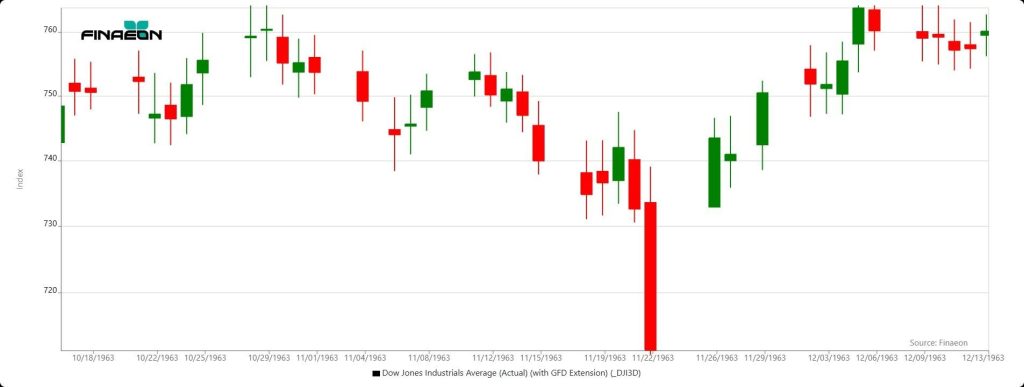
Source: Finaeon. Dow Jones Industrial Average historical data with GFD extension.
Exhibit 6: GFD U.S. 100 Index - Kennedy Assassination Period (1963)
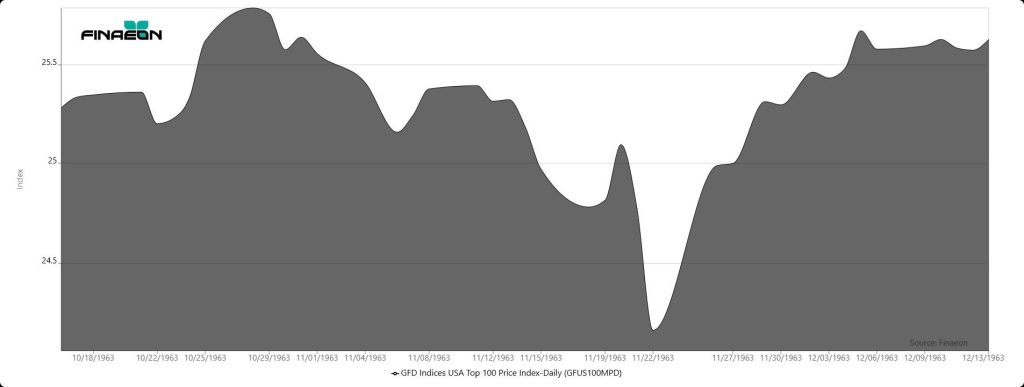
Source: Finaeon. GFD U.S. Index is proprietary intellectual property of Finaeon, Inc.
Yet what followed is more important than the decline. Within days, markets stabilized. Within weeks, both indices had regained lost ground, demonstrating resilience despite the magnitude of the event.
This event established what can be considered the modern behavioral template for markets under extreme political stress: a sharp initial drop, rapid reassessment, and a swift recovery.
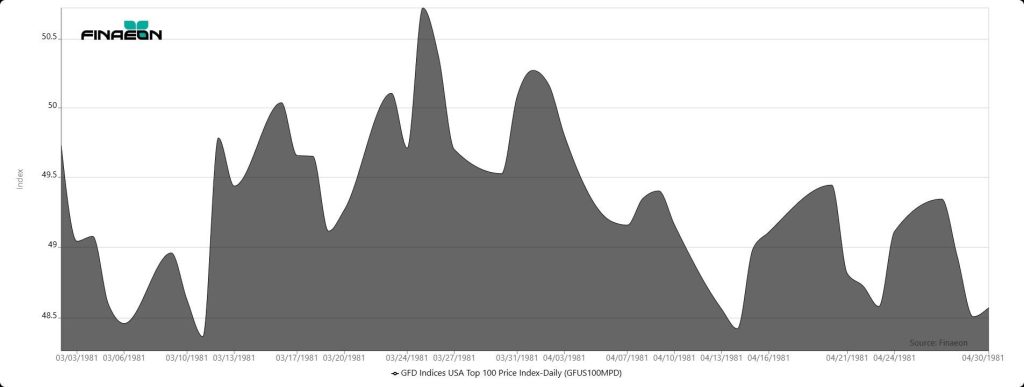
Reagan (1981): Faster Information, Faster Recovery
A similar pattern emerged during the attempted assassination of President Ronald Reagan on March 30, 1981. The S&P 500 declined modestly in the immediate aftermath as news spread, but once it became clear that President Reagan would survive, the market quickly rebounded. The event registered as a short-term disruption rather than a structural shift.
Exhibit 7: S&P 500 Composite Price Index - Reagan Assassination Attempt Period (1981)
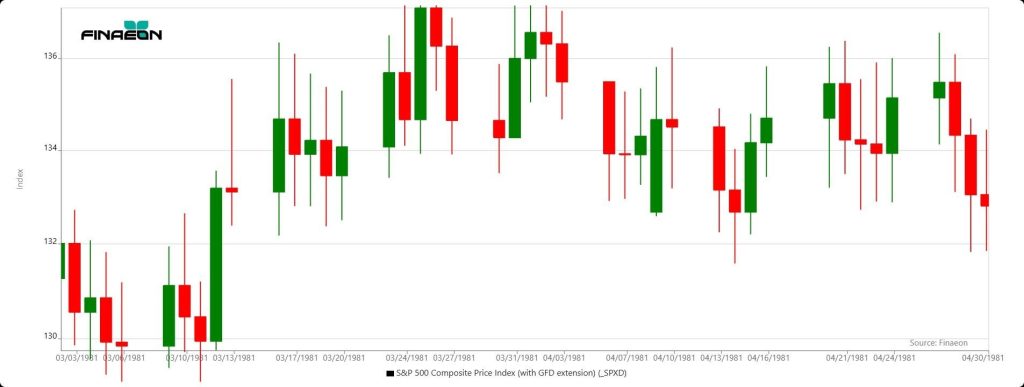
Source: Finaeon. S&P 500 Composite Price Index with GFD extension.
Exhibit 8: Dow Jones Industrial Average - Reagan Assassination Attempt Period (1981)
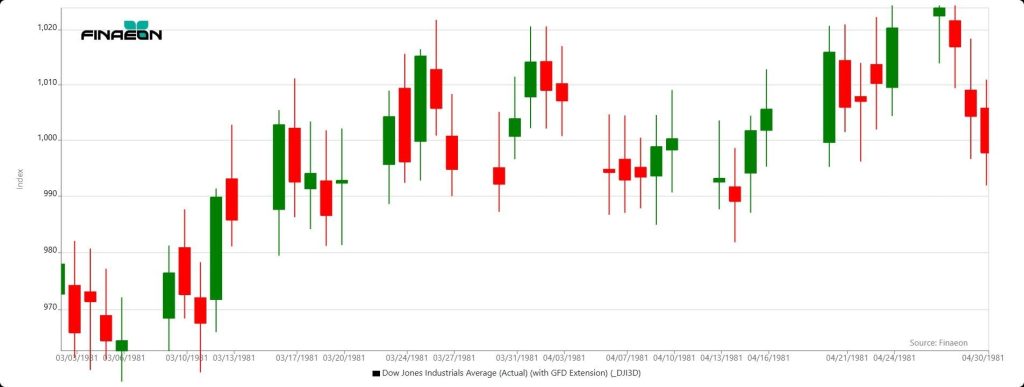
Source: Finaeon. Dow Jones Industrial Average historical data with GFD extension.
Exhibit 9: GFD U.S. 100 Index - Reagan Assassination Attempt Period (1981)
Source: Finaeon. GFD U.S. 100 Index is proprietary intellectual property of Finaeon, Inc.
By 1981, markets were more liquid, and information flowed more quickly. The speed of recovery reflects a key evolution: as information improves, uncertainty resolves faster.
Trump (2024): Real-Time Markets in a Real-Time World
The 2024 assassination attempt on President Donald Trump introduced another moment of acute uncertainty. As with prior events, initial market reactions reflected caution and risk repricing. Yet, consistent with historical precedent, markets demonstrated stability as information clarified and institutional continuity remained intact.
Exhibit 10: S&P 500 Composite Price Index - Trump Assassination Attempt Period (2024)
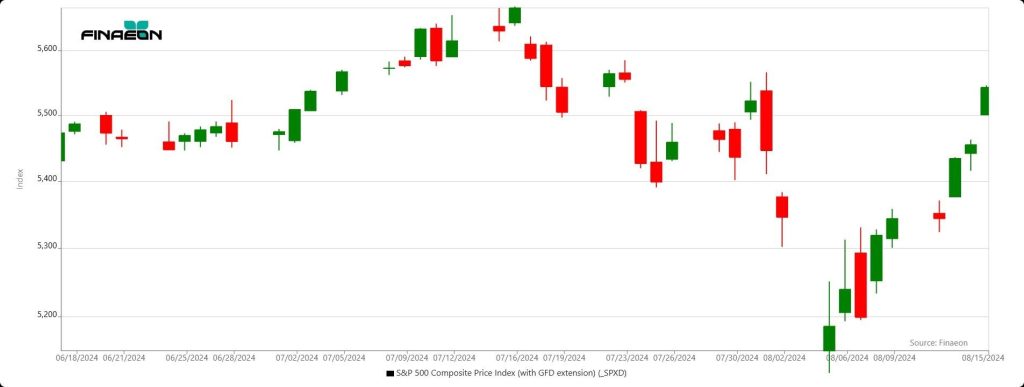
Source: Finaeon. S&P 500 Composite Price Index with GFD extension.
Exhibit 11: Dow Jones Industrial Average - Trump Assassination Attempt Period (2024)
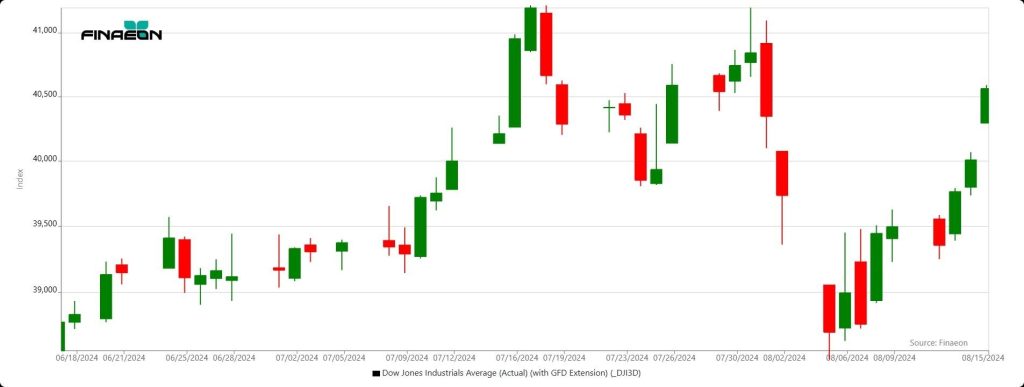
Source: Finaeon. Dow Jones Industrial Average historical data with GFD extension.
Exhibit 12: GFD U.S. 100 Index - Trump Assassination Attempt Period (2024)
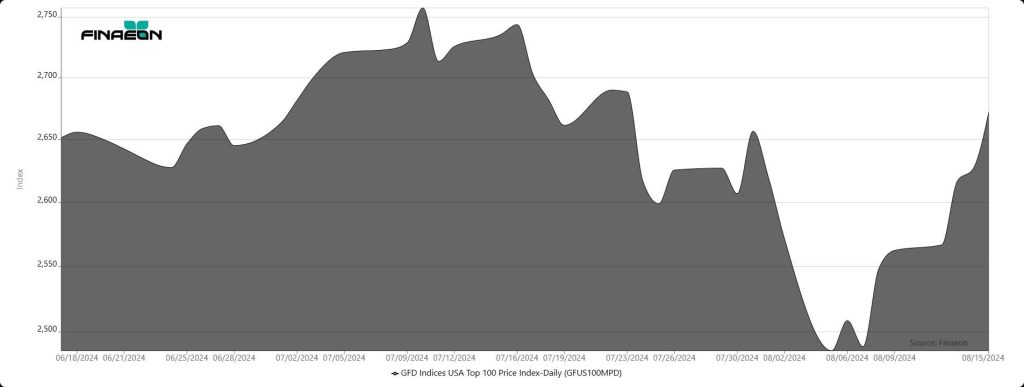
Source: Finaeon. GFD U.S. 100 Index is proprietary intellectual property of Finaeon, Inc.
In today’s environment, information is immediate, liquidity is deep, and institutional continuity is well understood. As a result, volatility appears quickly - but so does recovery.
A Consistent Pattern Across Time
Across these events, the S&P 500, the Dow Jones Industrial Average, and earlier reconstructed/proprietary indices exhibit a consistent behavioral pattern:
- Immediate Reaction - a short-term decline driven by uncertainty, fear, and incomplete information.
- Rapid Stabilization - markets begin to recover as facts emerge and worst-case scenarios are reassessed.
- Recovery - investors refocus on economic fundamentals, and prices normalize.
Why This Pattern Repeats
Because markets price systems, not individuals.
While leadership matters, the U.S. financial system is built on durable institutions - legal frameworks, monetary policy, central banking, regulatory systems, and diversified economic activity. These structures absorb shocks, even extreme ones.
The Role of Economic Context
Importantly, the economic context surrounding each event can influence the magnitude and duration of market reactions. The post-Civil War era, the industrial expansion of the late 19th and early 20th centuries, the Cold War economy of the 1960s, the high-inflation policy environment of the early 1980s, and the globally connected markets of today each represent very different macroeconomic environments.
Interest rates, inflation, global integration, liquidity, and market structure all shape how investors respond. However, despite these differences, the underlying pattern of resilience remains consistent over centuries of time.
The Power of Complete
This is where the importance of complete financial data becomes clear.
Short-term observations can be misleading. Isolated datasets or truncated time horizons may overstate risk or obscure recovery patterns. There is power in having access to complete data - data that spans full market cycles, multiple economic regimes, and the entire history of traded securities.
Finaeon is built on this principle.
With access to data on every stock ever traded, investors can move beyond index-level observations and examine how individual companies, sectors, and strategies behave during periods of disruption. Whether analyzing defensive sectors during crisis periods, identifying recovery leaders, or studying cross-market relationships, comprehensive data allows for deeper insight and more informed decision-making.
Markets are not only resilient - they are interconnected. The ability to analyze those interconnections across time provides a meaningful strategic advantage.
At Finaeon, we provide investors, researchers, and institutions with the tools to access, analyze, and understand complete financial data. We invite you to request a presentation and see firsthand how comprehensive data can support any investment style and uncover insights that fragmented datasets simply cannot provide.
Because in moments of uncertainty, the greatest advantage is clarity - and clarity comes from completeness.
Sources
Historical Events
- Wikipedia contributors. List of United States presidential assassination attempts and plots.
- Wikipedia contributors. Assassination of Abraham Lincoln; Assassination of James A. Garfield; Assassination of William McKinley; Assassination of John F. Kennedy.
- Wikipedia contributors. Attempted assassination of Ronald Reagan; Attempted assassination of Donald Trump.
Market Data
- Finaeon, Inc. Proprietary datasets: GFD U.S. 100 Index; S&P 500 Composite Price Index with GFD extension; Dow Jones Industrial Average historical data with GFD extension.
- GFD U.S. 100 Index is proprietary intellectual property of Finaeon, Inc.
Prepared for Finaeon, Inc. publication review