Bryan Taylor, Chief Economist, Finaeon
Finaeon has collected data on the Netherlands stock market enabling us to begin our monthly index of prices for the Netherlands in 1816. Companies that provided services in the Netherlands East Indies (now Indonesia) listed their shares in Amsterdam which enables us to provide an index for the Netherlands East Indies that begins in 1865 and goes up to World War II. This will allow us to directly compare the performance of shares in the Netherlands with other countries.
The Netherlands had a surplus of capital during the 1700s and 1800s which it used to invest in the bonds and shares of other countries. The Netherlands invested in American bonds and shares in the 1790s when the United States first began issuing stocks and bonds. The earliest data we have been able to collect for many foreign government bonds comes from Amsterdam in 1788. Before World War I, over 100 stocks and bonds from all over the world, primarily from the United States and Russia traded in Amsterdam. Dutch investors had no shortage of choice with over 500 stocks and bonds regularly trading on the Amsterdam stock exchange. Nevertheless, our focus is on Dutch shares that traded in Amsterdam.
The Delpher website provides access to Dutch newspapers from 1610 until the 2000s. The Algemeen Handelsblad and De Tijd were particularly helpful in providing historical data on stocks traded in Amsterdam. The newspapers provided data not only on prices, but on shares outstanding and dividends as well. The Van Oss’ Effectenboek provided information on individual companies. The Effectenboek comes in two volumes, one for domestic (binnenland) and one for foreign (buitenland) stocks. The domestic issues included companies from the Netherlands East Indies. Companies registered outside of the Netherlands and Netherlands East Indies were included in the Buitenland books. The two volumes were similar in size showing the importance of foreign stocks that listed on the Amsterdam Stock Exchange.
Historical Returns to the Netherlands
The Central Bureau of Statistics (CBS) calculated an index for Netherlands shares beginning in 1919 which included 50 stocks. Royal Dutch Shell, now Shell plc, represented over one-third of the market capitalization of the Dutch stock market during the past 100 years so there was a high correlation between the performance of Royal Dutch Shell and the Dutch stock market in general. The Amsterdam Stock Exchange All-Share index has been calculated daily since 1980. However, no index data is available before 1919.
Shares of the Dutch East India and Dutch West India Companies were traded in the 1700s; however, both companies went bankrupt in the 1790s. The Netherlands formed the Nederlandsche Bank in 1816 to aid the development of the Dutch economy. The Nederlandsche Handel Maatschappij was formed in 1825 to carry out Dutch trade with the Netherlands Indies. These two stocks provided the backbone to the Amsterdam Exchange. Before 1875, there were fewer than a dozen shares listed on the exchange, but this increased to 200 by 1900 and 500 by 1914 when the stock exchange closed during World War I.
After we collected the data for the Amsterdam Stock Exchange, we calculated indices for the Netherlands based upon this data which is provided below. There was little change in the index between 1816 and 1835. Nederlandsche Handel shares rose in price between 1835 and 1837, but shares stabilized until 1860. Between 1860 and 1920, there was a steady increase in the price of Dutch stocks with prices doubling in value. After 1920, Dutch shares suffered a steady decrease, losing over 86% of their value between 1920 and 1932. Since then, Dutch shares have steadily increased in value.
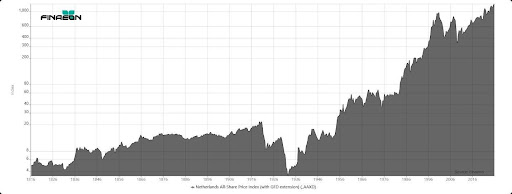
Figure 1. Netherlands All-Share Price Index, 1816 to 2025
However, it should be remembered that the Amsterdam Stock Exchange provided Dutch investors a diverse choice of securities to invest in. There was almost an equal number of bonds and shares to choose from as well as a similar number of domestic and foreign securities. Share lists provided separate sections for domestic and foreign securities to make it easier for investors to choose between them. Before World War II, the Gold Standard provided fixed exchange rates between currencies making it easy for investors to choose between domestic and foreign securities. This contributed to the steady success of the Dutch market between 1860 and 1920 since if Dutch companies provided poor returns, investors could always choose foreign securities.
The transition to a post-World War I economy in which capital did not flow freely between countries reduced returns. The Dutch market was small, limiting growth in the economy. and the stock market declined during the next 12 years. The market bounced back after hitting a bottom in 1932; however, Germany occupied the Netherlands during World War II (the Netherlands was neutral during World War I) restraining growth until the Netherlands recovered after World War II. The largest stock in the Netherlands has been Koninklijke Nederlandsche Maatschappij tot Exploitie van Petroleumbronnen in Nederlandsch-Indie, also known as Royal Dutch Petroleum. A graph of its price is provided below. As can be seen, the stock showed little change between 1910 and 1950. The company is now known as Shell plc and is registered in the United Kingdom.
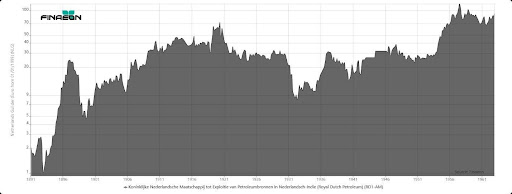
Figure 2. Royal Dutch Petroleum Stock Price, 1891 to 1963
Information on returns to stocks, bonds and bills along with information on the Stock-Bond Equity Risk Premium and the inflation rate is provided in Table 1. All data are provided in US Dollars after inflation. Dutch investors earned double-digit returns during four decades, the 1940s, 1970s, 1980s and 1990s. The only decade during which Dutch stocks provided a negative return was the 1920s, during which the United States provided shareholders with one of the best decades on record. Bond returns were low between 1939 and 1969 as inflation rose but were high between 1969 and 2009 as inflation declined.
The overall rate of return between 1816 and 2024 was 5.97% for stocks, 2.88% for bonds and 1.46% for cash in real USD while the inflation rate was 1.54%. This provides an ERP between stocks and bonds of 3%. Between 1949 and 2024, stock returns were higher at 7.58% with lower returns to bonds at 2.15% and cash at 0.99%. However, since 2000, returns to all three assets have been low, at 1.53% for stocks, 0.92% for bonds and -0.93% for cash. One can only hope that these returns don’t remain low for the rest of the century.
|
Stock Price |
Stock Return |
Bond Return |
Bill Return |
ERP |
Inflation |
|
|
Real USD |
Real USD |
Real USD |
Real USD |
Stocks-Bonds |
||
|
By Decade |
||||||
|
1819-1829 |
-0.37 |
4.28 |
9.3 |
3.35 |
-4.60 |
-1.6 |
|
1829-1839 |
5.17 |
11.03 |
3.18 |
2.88 |
7.61 |
0.21 |
|
1839-1849 |
-1.07 |
5.08 |
5.51 |
3.13 |
-0.40 |
-1.3 |
|
1849-1859 |
2.21 |
7.68 |
6.16 |
3.47 |
1.44 |
0.24 |
|
1859-1869 |
2.43 |
8.65 |
2.26 |
3.64 |
6.25 |
-0.16 |
|
1869-1879 |
2.15 |
9.28 |
5.82 |
3.2 |
3.27 |
0.23 |
|
1879-1889 |
-1.05 |
3.66 |
6.35 |
2.82 |
-2.52 |
-1.83 |
|
1889-1899 |
0.72 |
6.19 |
2.65 |
2.47 |
3.45 |
-0.76 |
|
1899-1909 |
1.73 |
7.98 |
2.72 |
3.12 |
5.13 |
1.94 |
|
1909-1919 |
1.74 |
9.54 |
-0.2 |
3.56 |
9.76 |
7.02 |
|
1919-1929 |
-6.1 |
-0.12 |
6.62 |
4.49 |
-6.32 |
-2 |
|
1929-1939 |
-1.31 |
3.36 |
7.23 |
4.38 |
-3.61 |
-1.36 |
|
1939-1949 |
-0.64 |
1.96 |
-3.37 |
-6.28 |
5.51 |
7.81 |
|
1949-1959 |
13.81 |
18.05 |
1.21 |
2.72 |
16.64 |
3.8 |
|
1959-1969 |
2.79 |
6.51 |
2.28 |
3.81 |
4.13 |
3.97 |
|
1969-1979 |
5.65 |
12.73 |
14.66 |
12.29 |
-1.68 |
7.18 |
|
1979-1989 |
13.71 |
20.21 |
9.58 |
7.38 |
9.70 |
2.7 |
|
1989-1999 |
14.91 |
18.99 |
7.27 |
4.3 |
10.92 |
2.41 |
|
1999-2009 |
-2.28 |
0.91 |
9.65 |
6.6 |
-7.97 |
2.02 |
|
2009-2019 |
2.68 |
6.21 |
1.92 |
-2.31 |
4.21 |
1.72 |
|
By Era |
||||||
|
1816-1914 |
0.87 |
6.61 |
4.39 |
2.84 |
2.13 |
-0.37 |
|
1899-1999 |
1.19 |
6.32 |
1.46 |
0.68 |
4.79 |
3.3 |
|
1914-1981 |
-1.42 |
3.55 |
0.39 |
-0.14 |
3.15 |
3.98 |
|
To the Present |
||||||
|
1816-2024 |
0.88 |
5.97 |
2.88 |
1.46 |
3.00 |
1.54 |
|
1899-2024 |
0.63 |
5.34 |
1.35 |
0.36 |
4.79 |
1.03 |
|
1914-2024 |
0.89 |
5.4 |
1.54 |
0.24 |
3.79 |
3.29 |
|
1949-2024 |
3.3 |
7.58 |
2.15 |
0.99 |
5.31 |
3.44 |
|
1999-2024 |
-1.55 |
1.53 |
0.92 |
-0.93 |
0.61 |
2.35 |
Table 1. Returns to Dutch Stocks, Bonds and Bills, 1816 to 2024
Table 2 provides a record of bear markets between 1816 and 2025. The worst bear market was between 1929 and 1932 when the market declined 76.4%. If you use 1920 as the starting point for the bear market, the total decline was 86.4%, similar to the decline in the United States between 1929 and 1932. There have been two major bear markets in the Netherlands during the 21st Century. The market declined by 66.9% between 2000 and 2003 and by 63.6% between 2007 and 2009. These large bear markets help to explain the poor performance of Dutch stocks during the 21st Century. No other bear market has declined by over 50%, although the 1969-1974 bear came close.
Table 2. Bull and Bear Markets in the Netherlands |
Historical Returns to the Netherlands East Indies
Institutionalized trading began in Jakarta in 1898. The Jakarta Stock Exchange was founded in 1912 and the Surabaya Stock Exchange in 1924. Both operated until 1939 and were closed when the Japanese invaded the Netherlands East Indies. The Jakarta Stock Exchange closed between August 1914 and April 1915, closed in May 1940 and reopened in December 1940. The Jakarta stock exchange closed in March 1942 and remained closed until 1952. Although the stock exchange has remained open since then, trading was at a minimum between the 1950s and 1970s.
Between 1865 and 1940 over 100 companies that operated in the Netherlands Indies listed shares in Amsterdam. The first company to do the Nederlandsche Handel Maatschappij which was founded in 1824 by King Willem I to boost trade and shipping with the Netherlands East Indies and other countries. The index that we provide uses the price of Nederlandsche Handel Maatschappij from 1824 to 1875, the GFD Index of the Netherlands East from 1876 to 1923 and the Netherlands ANP-CBS Colonial/Foreign Trade Index from 1924 to 1986. A comparison of the performance of shares in the Netherlands and Netherlands East Indies between 1824 and 1986 is provided below. Although the values differ, the two charts follow a similar path up until World War II. After World War II, Dutch companies either did not regain control over their assets in Indonesia, or they internationalized their operations in anticipation of the future loss of their assets in Indonesia. Dutch assets were seized by the Indonesian government in December 1957 and formally nationalized in December 1958. These companies were no longer “Indonesian” companies.
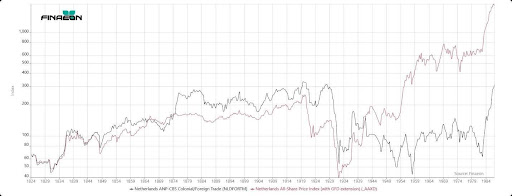
Figure 3. Netherlands Price Index and Netherlands Colonial Price Index, 1824 to 1986
Unfortunately, this Netherlands East Indies index cannot be linked up with the Jakarta SE Composite Index. The Netherlands and Indonesia had significantly different inflation rates between 1945 and 1986. The ANP-CBS index was calculated in Dutch Guilder and the Jakarta SE Composite, which begins in 1979, in Indonesia Rupiah. If an index had been calculated for shares traded on the Jakarta Stock Exchange after World War II, it would have risen dramatically more than the Amsterdam index simply because of the inflation. This was also true between 1979 and 1986 when both indices existed simultaneously.
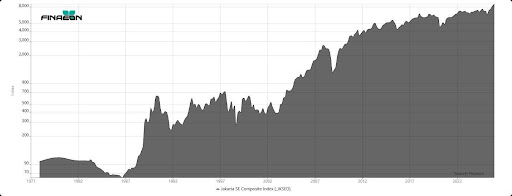
Figure 4. Jakarta Stock Exchange Composite Index, 1977 to 2025
The Jakarta SE Composite is illustrated in Figure 4. As can be seen, there were two significant increases in the value of Indonesian stocks. The first occurred between 1986 and 1990 when the index increased tenfold. The second advance took place between 2002 and 2013 when the stock market advanced fifteen-fold. If you were to adjust for inflation, the Jakarta SE has hit similar bottoms in 1986, 1998 and 2002. After inflation, the JKSE Composite was still below its 1990 peak in 2025.
A record of the bull and bear markets in the Netherlands East Indies is similar to the data from the Netherlands. As in the Netherlands, the greatest decline occurred between 1928 and 1932, when the market index declined by 83%. Shares from the Netherlands East Indies showed greater volatility then Netherlands shares with each decline after World War II exceeding 50%.
|
Market Bottom |
Bear Loss |
Market Top |
Bull Rise |
|
4/30/1824 |
|||
|
12/31/1830 |
-33.02 |
08/31/1836 |
164.44 |
|
04/30/1848 |
-35.29 |
6/30/1857 |
106.75 |
|
7/31/1870 |
-36.31 |
6/30/1881 |
182.02 |
|
09/30/1891 |
-38.93 |
03/31/1897 |
59.02 |
|
11/30/1903 |
-38.52 |
9/30/1912 |
72.05 |
|
7/31/1914 |
-22.84 |
8/31/1919 |
51.13 |
|
6/30/1924 |
-49.94 |
1/31/1928 |
87.12 |
|
5/31/1932 |
-83.02 |
3/31/1937 |
269.79 |
|
12/31/1946 |
-67.37 |
3/31/1948 |
63.91 |
|
6/30/1952 |
-52.98 |
9/30/1955 |
135.07 |
|
1/31/1958 |
-65.25 |
1/31/1973 |
267.35 |
|
9/30/1982 |
-58.20 |
12/31/1986 |
401.91 |
Table 3. Bull and Bear Markets in the Netherlands East Indies
Conclusion
Global Financial Data has extended its monthly data for the Netherlands back to 1816 and for the Netherlands East Indies back to 1824. The record for stocks traded in the Netherlands actually begins in 1602, but the East and West India Companies went bankrupt in 1794 creating a gap in the trading of shares in Amsterdam.
This research enables us to compare the performance of stocks from these two countries with shares from other countries. Before World War I, the Netherlands had an open economy that invested in bonds and shares not only from the Netherlands, but from around the world. Foreign government bonds had listed on the Amsterdam Stock Exchange since the 1780s and mutual funds for foreign bonds were traded in the 1790s. Because there were few limits on capital flows in and out of the Netherlands, Dutch shares provided returns which matched or exceeded returns in other countries.
This changed after World War I when investment opportunities in foreign stocks became more limited. Stocks showed significant declines during the 1920s and 1930s. This changed after World War II. Domestic stocks recovered, but Indonesian stock struggled to rise in value. Belgium displayed a similar pattern of greater volatility but lower returns between domestic and colonial stocks.
The Netherlands has provided a stable environment for investors and the Dutch Guilder was one of the strongest currencies during the 20th Century. Although Dutch shares have underperformed during the 21st Century relative to the 20th Century, the Netherlands stock market includes important multinationals such as ASML Holding, worth over $700 billion. The Netherlands should continue to provide returns equal to or superior to the rest of Europe in the years to come.